If a delay in user interaction becomes longer than 100 ms, it starts to become noticeable. - Apple on App Responsiveness
Multi makes any app you share multiplayer, and that includes Shared Control: The ability to directly interact with shared apps.
Shared control works by forwarding commands to the sharer’s computer, then piping updated video frames back to the controller. Depending on where you are in the world, the round trip currently takes much longer than 100 ms, and we’ve been working to lower that latency.
Network is usually the main culprit of latency, and we’re currently working on using peer-to-peer connections to cut out as many network hops as possible.
But what about the latency inside the app, before or after we go through the network?
Swift tools for real time data streams
Multi is a native Swift application. In the Swift ecosystem, data pipelines can be implemented in many different ways: :
Just calling a method or the delegate pattern
Grand Central Dispatch, using DispatchQueues
Combine, executing on the same thread or a different queue
Swift Concurrency, using actor methods calls or AsyncStreams
Each of these have their own pros, cons and historical reasons. We know all of these tools are usually fast and good enough for realtime features.
But where’s the limit? How can we compare each of these approaches? Is there a noticeably faster option?
Test #1 - Alarming but flawed
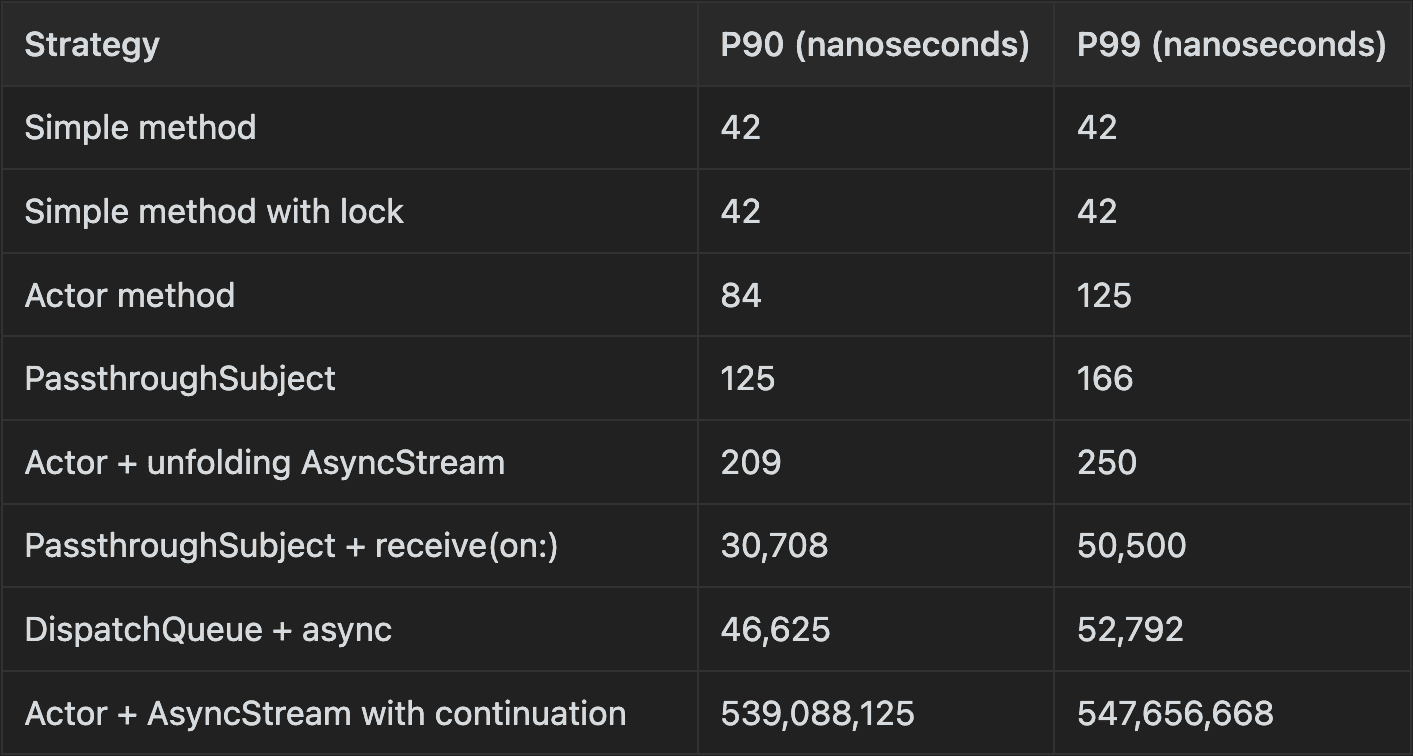
First, we ran a naive latency comparison between using locks, actors, Combine and Async Streams. We were aghast to see an actor consuming from an AsyncStream would have 539 milliseconds of latency while the other approaches were taking at most a few microseconds!
Latency for an actor consuming from an AsyncStream. Range: 0-600 milliseconds
The big difference in latency for Actors consuming Async Streams with continuations was really suspicious. Was there something wrong? Our initial tests were executing each strategy a million times one after the other. This was great because it allowed us to collect a lot of samples while running the whole suite of tests within a few seconds. The problem was that this workload was not representative of our use case.
Specifically, what happened was that our naive tests were hitting a somewhat common problem developers have to avoid in messaging systems, which is when the producer produces elements faster than the speed at which the consumer can consume them. As developers, we need to make sure that doesn’t happen for long periods of time in prod, otherwise things could go pretty bad.
AsyncStreams, unless configured otherwise, are basically a queue. The code emitting elements had to just add a timestamp to a queue while the code consuming it had to create a timestamp but also add it to an array and check if the test was done. Work is not balanced, leading to a larger and larger queue with longer and longer timestamps. Also, maybe AsyncStreams intrinsically have different speeds for write and reads?
It was especially hard to see because DispatchQueues didn’t degrade at this level, even if they did degrade a bit, as we can see in the charts.
AsyncStreams degraded way faster. This is something to keep in mind. Do you know why this happened? Let me know!
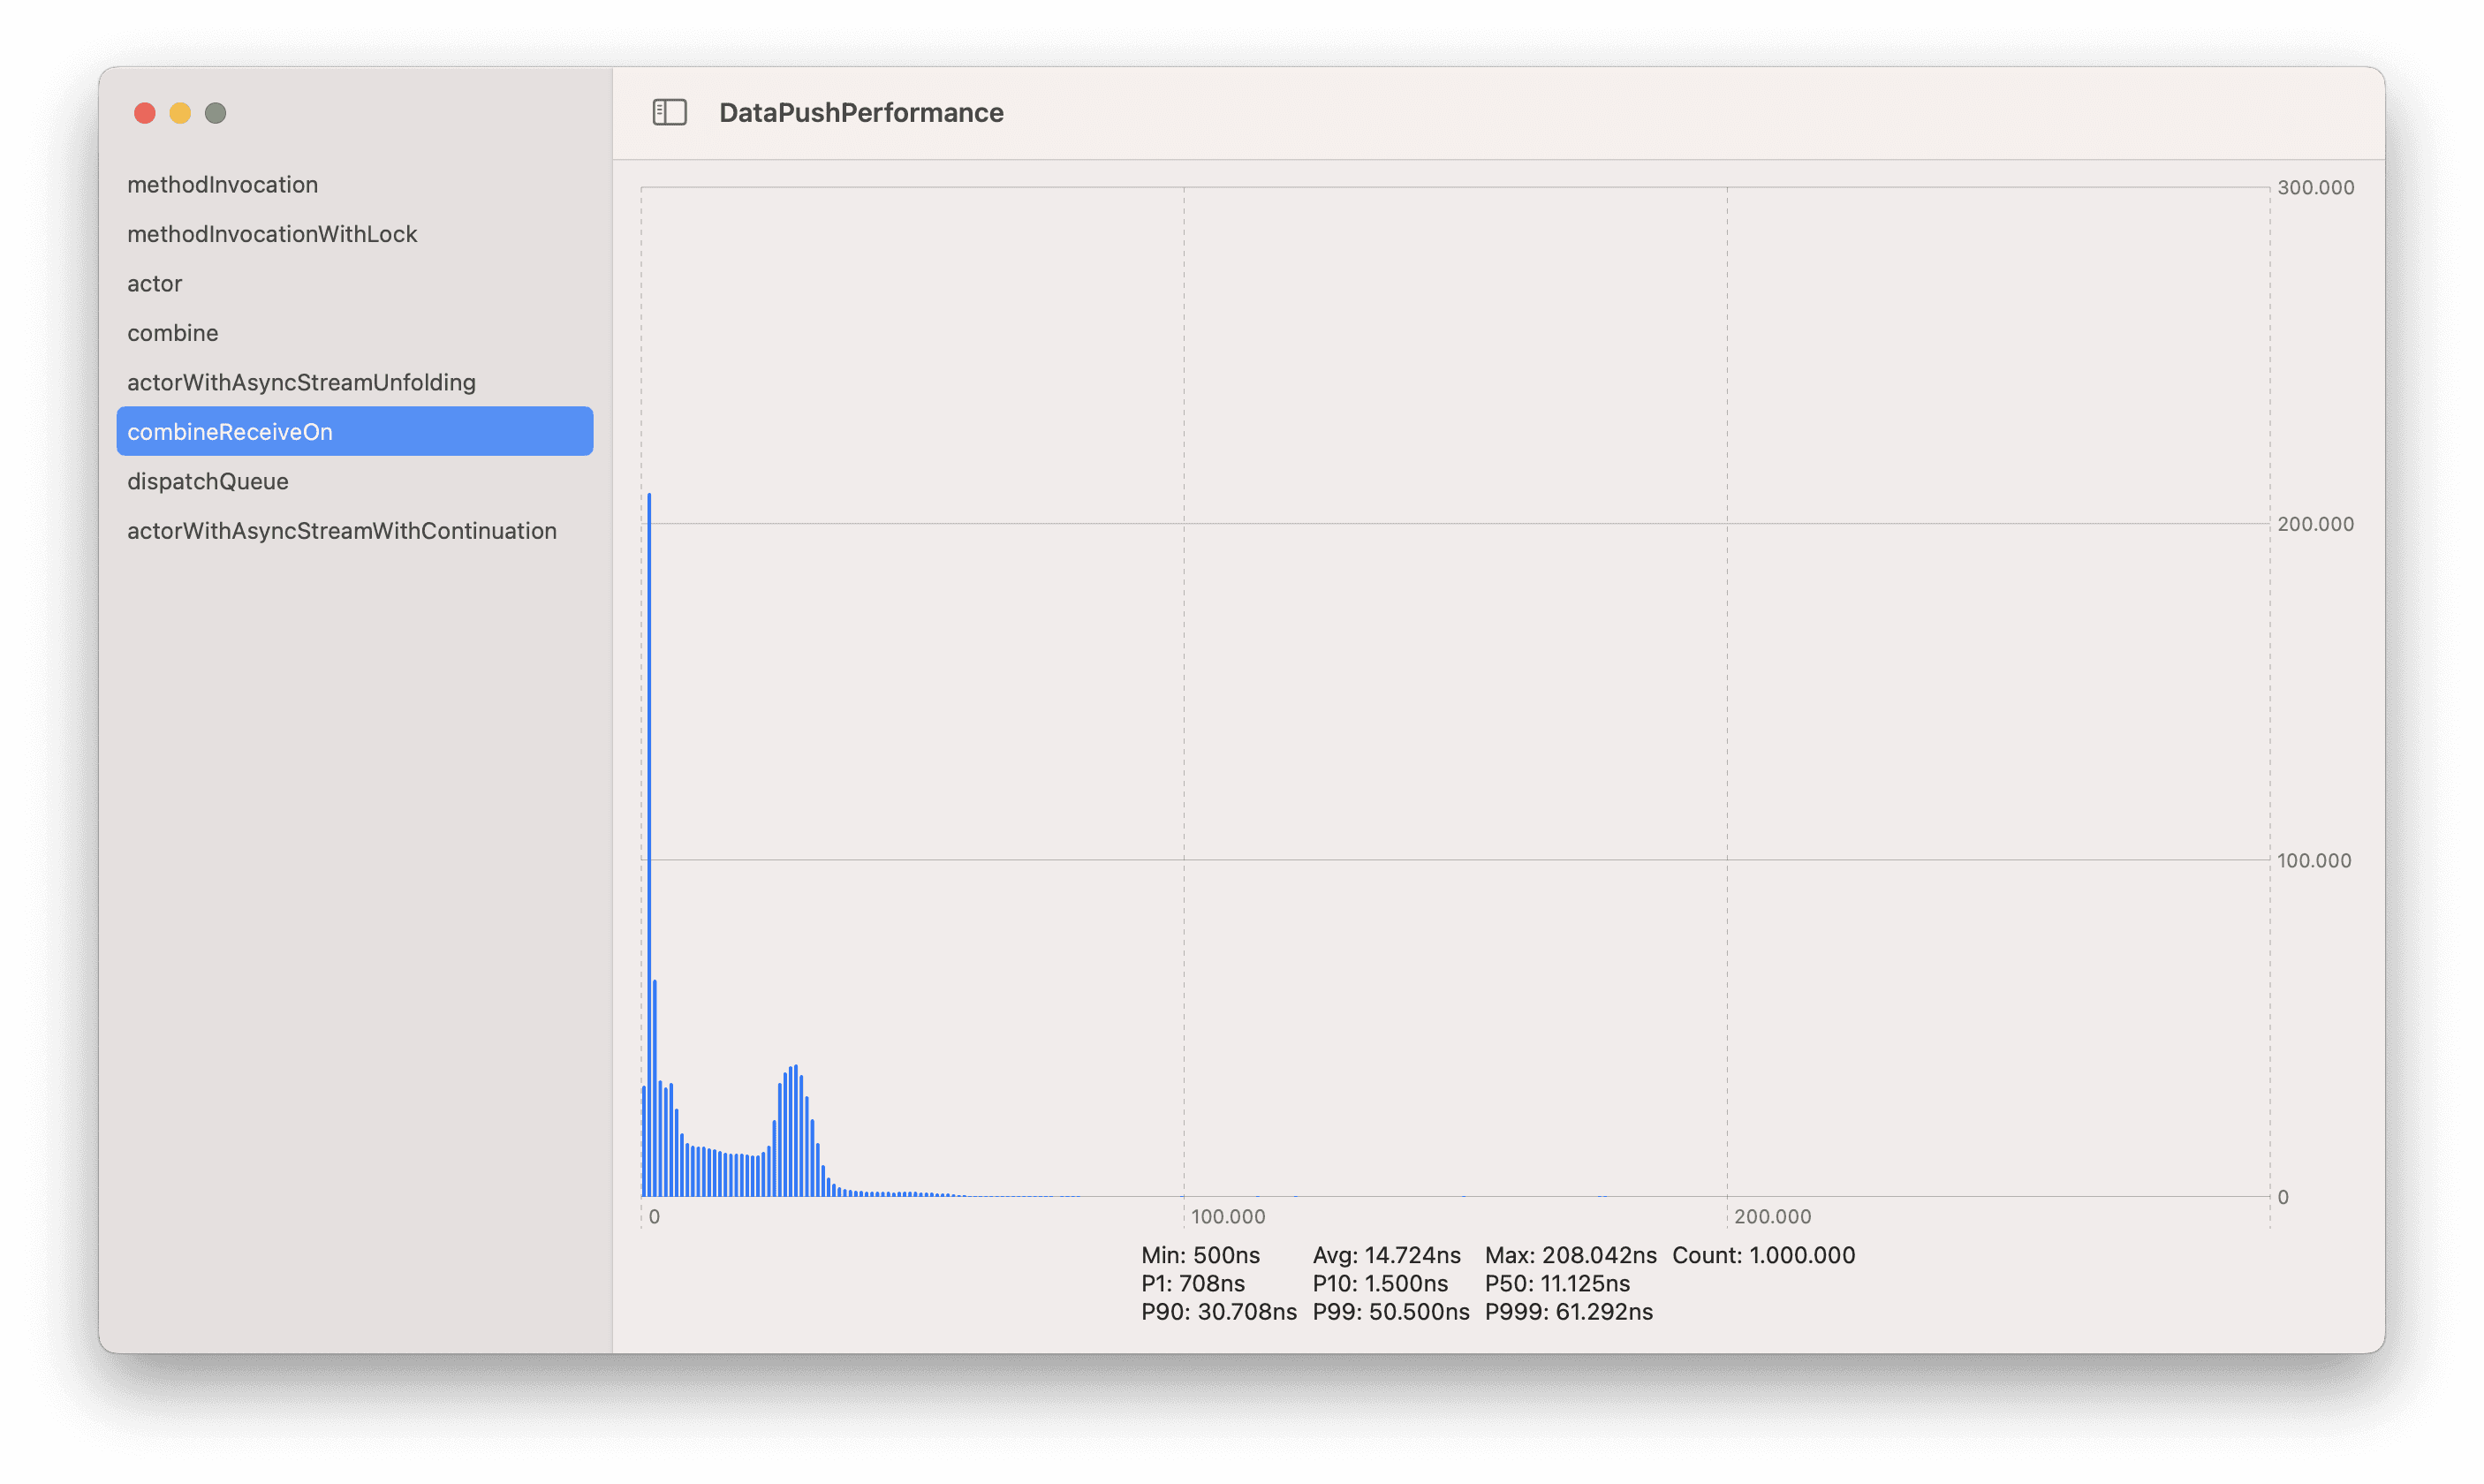
Combine + DispatchQueue P99 was 50.500ns. Scale 0-300 microseconds
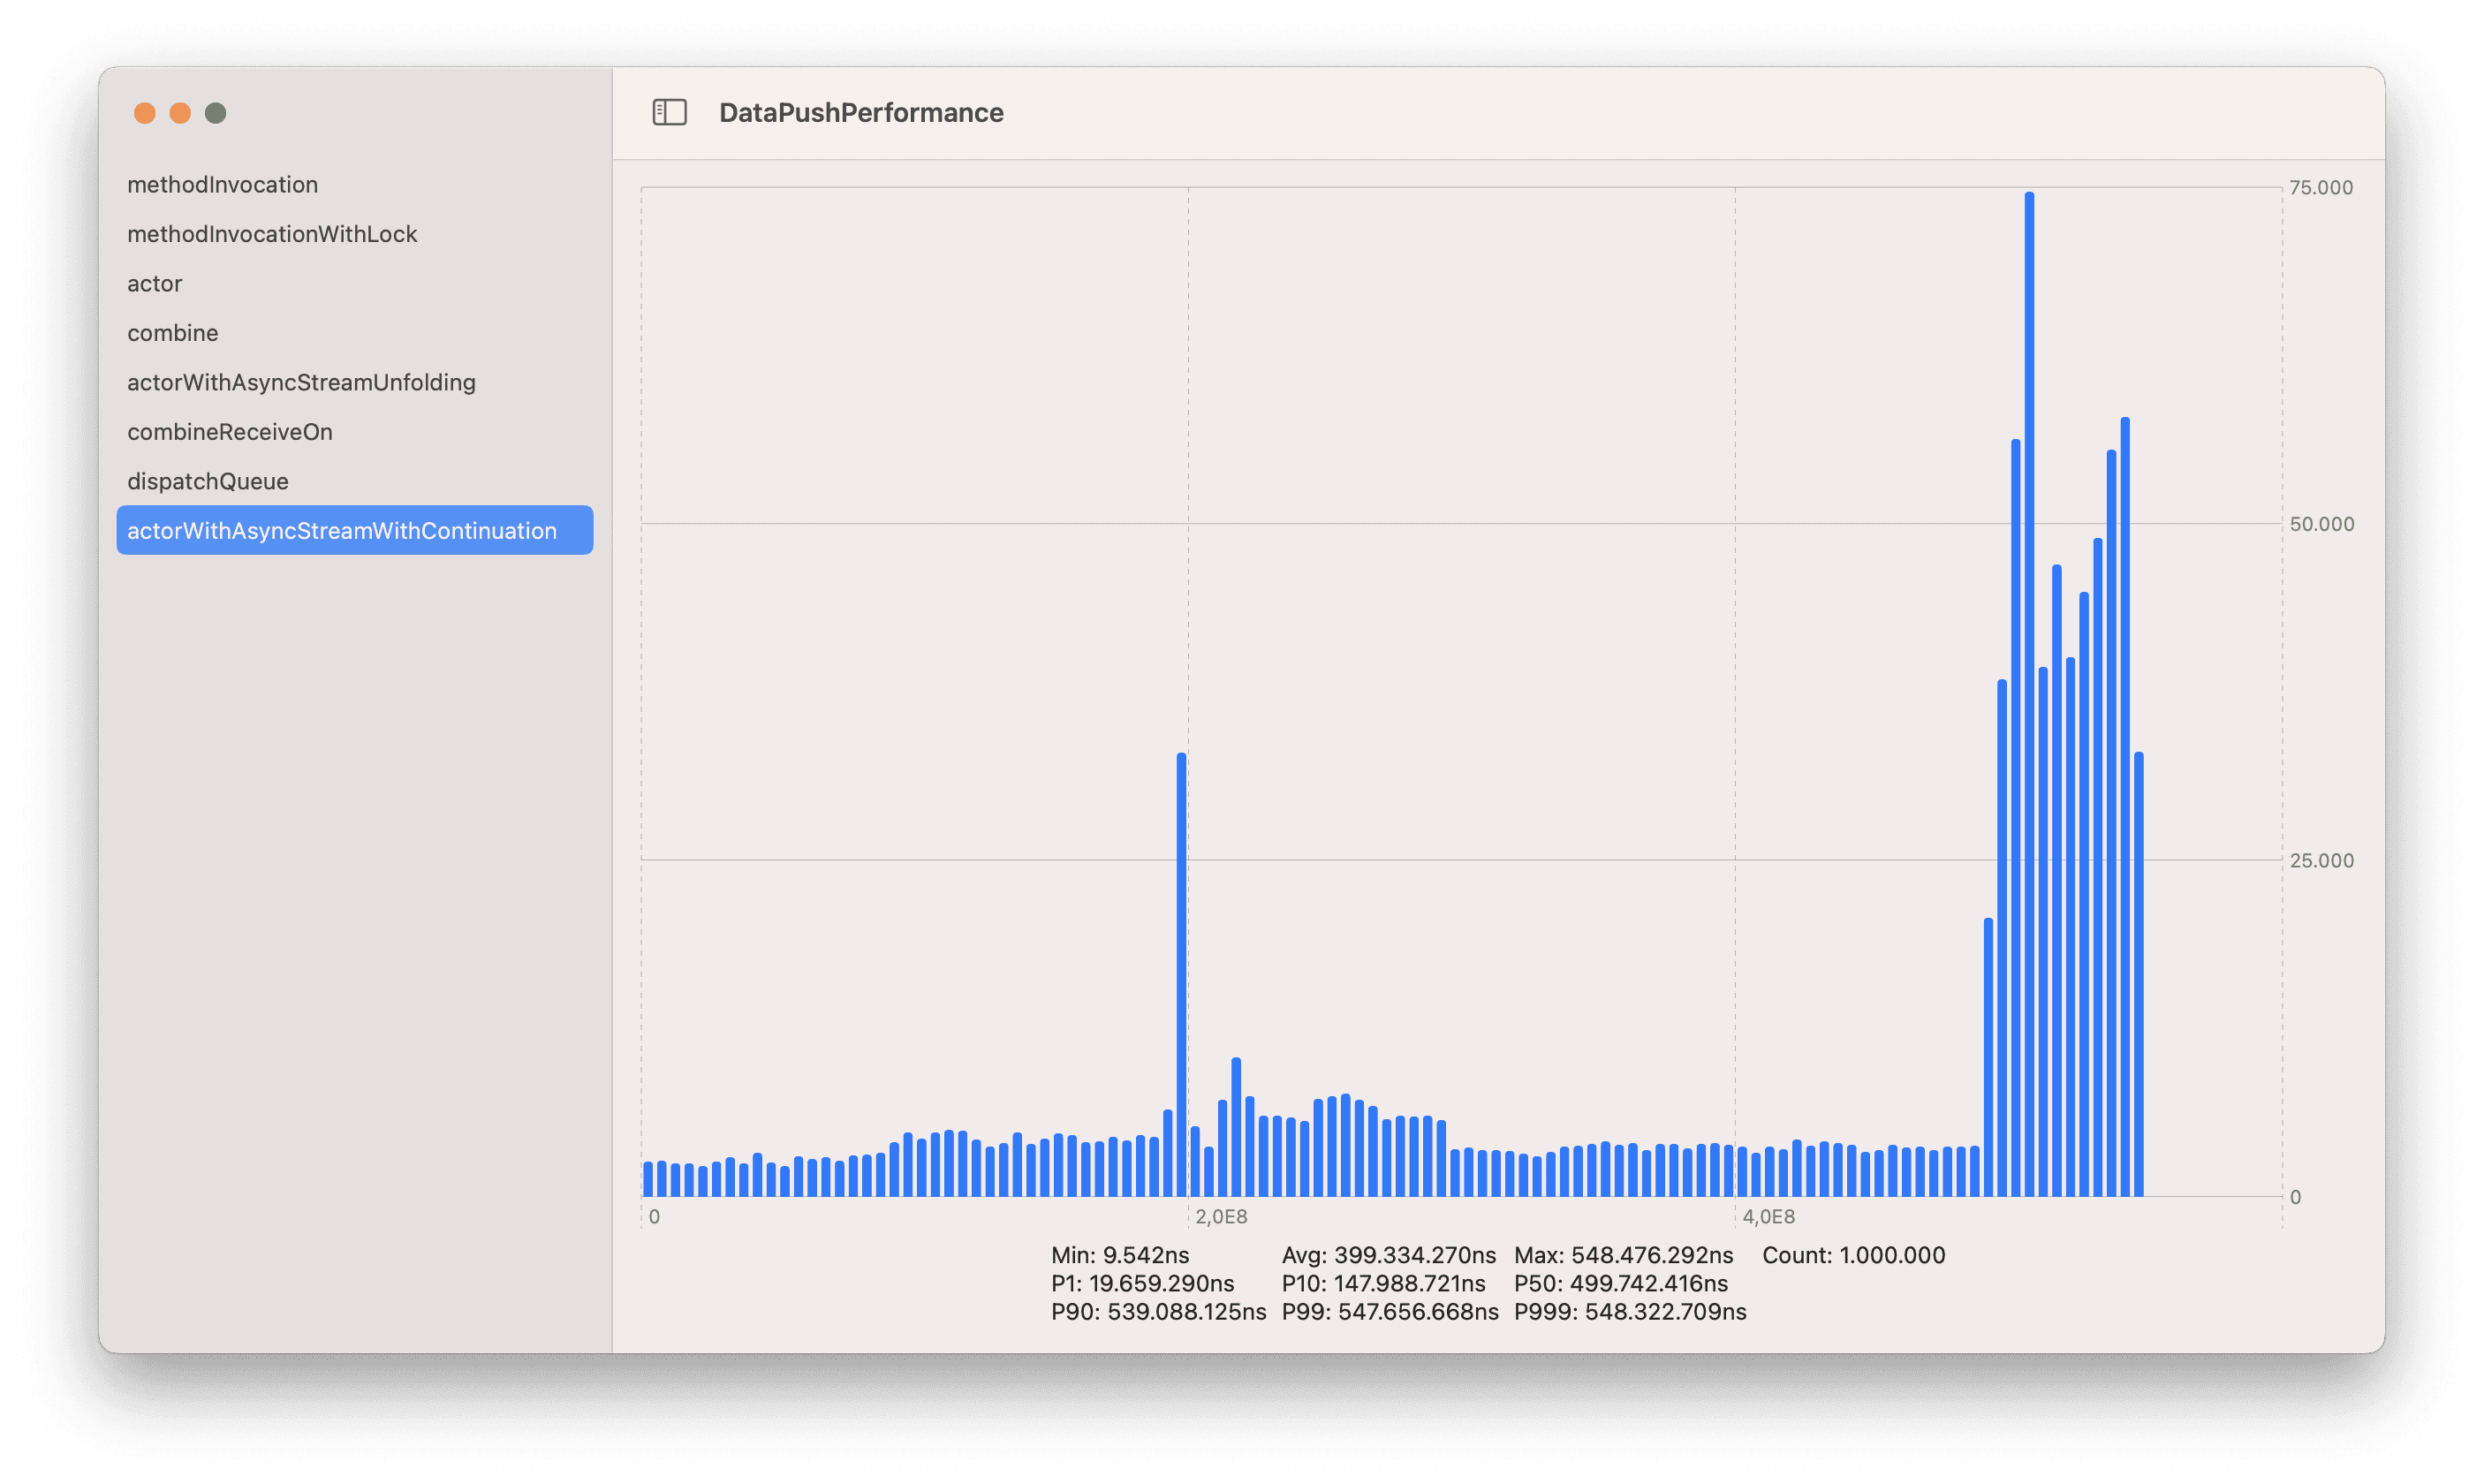
AsyncStreams P99 was 547.656.668ns. Scale: 0-600.000 microseconds
The test was flawed because we wanted to use it to learn more about these tools to apply the learnings in our remote control case. The case coded in these tests was not representative of how we would use these tools for remote control. So, we tried something else to get closer to testing actual user scenarios.
Round #2 (a slightly more realistic test for our use case)
We adjusted our test to be more representative of what would actually happen in our app. Here’s the code for it: https://github.com/Remotionco/DataPushPerformance.git
When the DataPushPerformance app starts, it takes around 5 minutes to run a series of latency tests. Then, it shows a chart of latency and stats for each specific approach. Each test now runs 60 executions per second up to reaching 2000 executions per approach. For each execution we get timestamps before and after it so we can get some stats about it.
We downgraded from 1.000.000 samples to 2.000 samples, but now the test is more similar to the conditions of a video stream with 60 FPS or a user typing too fast. ;)
Results are ordered from fastest to slowest. Order and results might vary slightly between different runs. Each chart has a different range in both coordinates. I ran these on a release build in a MacBook Pro 16 inch, 2021.
As a reference, each test is implemented following a structure similar to this one:
These were the results:
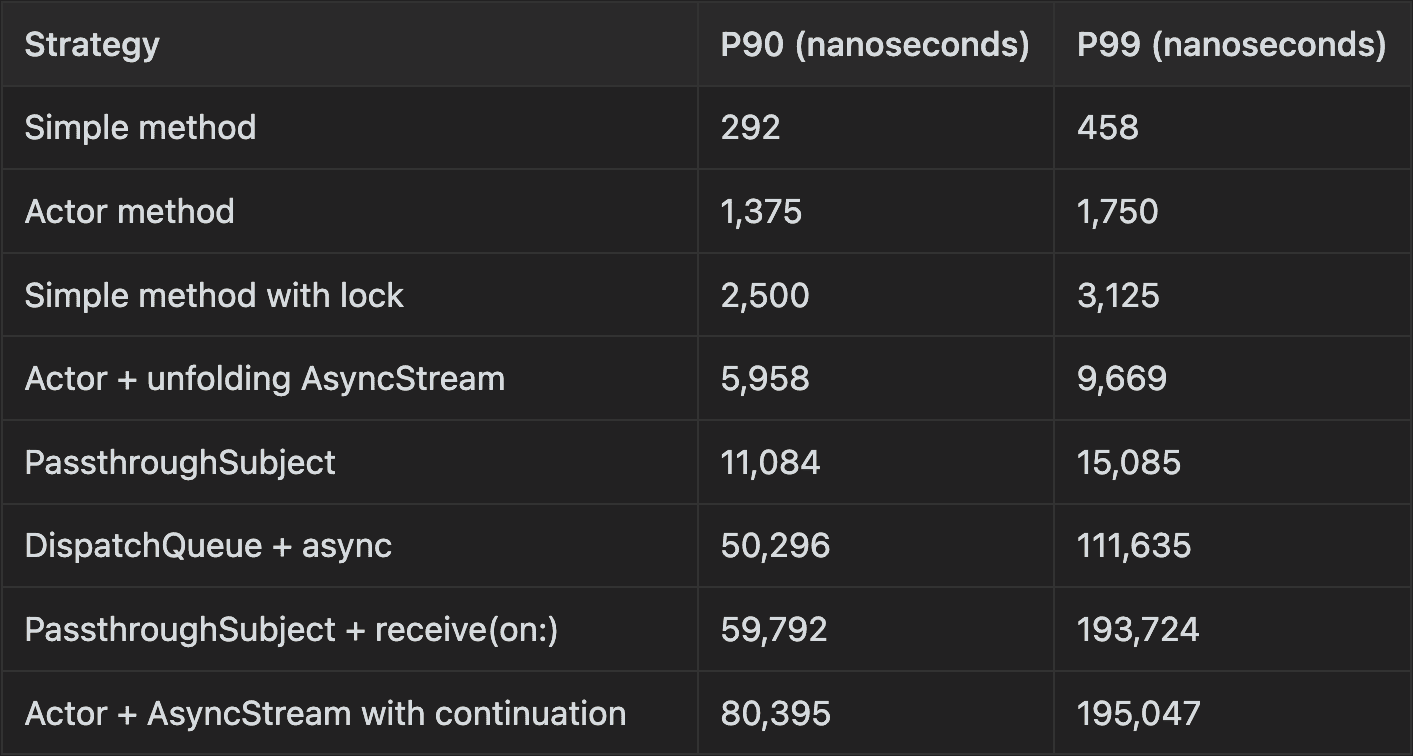
As you can see, the results for “Actor + AsyncStream with continuation” are much more reasonable.
It’s worth noting that these tests are not scientific by any means. There are many details to be considered, like specific OS version, hardware, current state of CPU and memory caches, current CPU and memory workload, the type of data workload, compiler optimizations for each specific use case, etc.
Experimental Conclusions
Latency is not deterministic and has a wide distribution.
All the methods tested are fast enough for “realtime” applications that need to usually be within the millisecond. For most “multiplayer realtime” applications, this applies.
However, if you need stronger guarantees of sub-millisecond latency, consider avoiding the last few options.
Avoid hops between threads and chaining multiple mechanisms like the ones used here. These can add up and reach the millisecond range for P99.
Latency depends on many different factors and context and how the tools are used is key. If you write tests, make sure they capture the most important part of how they are going to be used. Better yet, measure the complete features being used in prod!
How we incorporated this into Multi
We actually use all of these tools in our codebase for different purposes.
For the remote control data pipeline, we ended up using delegate methods and locks. Not fancy, but simple and predictable. Also, it integrates consistently with WebRTC delegate methods.
We use Combine for dynamically dispatching commands to different parts of the app, when we need to register listeners to live data streams dynamically in a thread-safe way. Combine also helps keep the code organized.
We also use AsyncStreams in our experimental custom screenshare data pipeline. It might use some more microseconds compared to other approaches, but it keeps the code more simple for that use case. Now that we’ve run these tests, we might test different approaches.
The important thing here is to implement the features and measure them. We implemented in-app latency measuring mechanisms like a ping utility and background remote control round trip latency (data channel + screenshare) to keep latency visibility under control.
These tests were a fun and interesting experiment. Remember that latency requirements might vary wildly between different contexts. We wanted to focus on user perceived latency but you might pay attention to other aspects depending on your requirements.
Is there any approach you’d like to add to the latency measurement app? Create a PR and send me an email at Fernando at multi dot app!
