Multi is a pair programming tool that makes any app multiplayer. Multiple people can share at the same time, providing everyone shared cursors, drawing, and even shared control.
When we launched last August, our users experienced noticeable input lag—over 250ms—for the majority of sessions. We’d made the decision to launch then because we knew that rigorously measuring and improving latency would take longer than we could afford to delay.
Now it’s better: We recently shipped a 2.3x reduction in control latency. Now, 90% of control sessions come in below 200ms, and same-region pairs regularly see sub-100ms latency.
We faced 3 challenges:
How do we build an accurate latency metric across the many components involved in shared control across devices?
Latency is highly dependent on network. How do we quickly evaluate improvement of a noisy metric—one that in production has a wider standard deviation than its expected value?
How do we implement and configure WebRTC to reduce latency without sacrificing legibility of shared code?
This post covers the first two challenges, and the third is covered by the next post in this series.
Challenge 1: Building an accurate latency metric with hidden watermarks
1a. Steps taken on a round trip
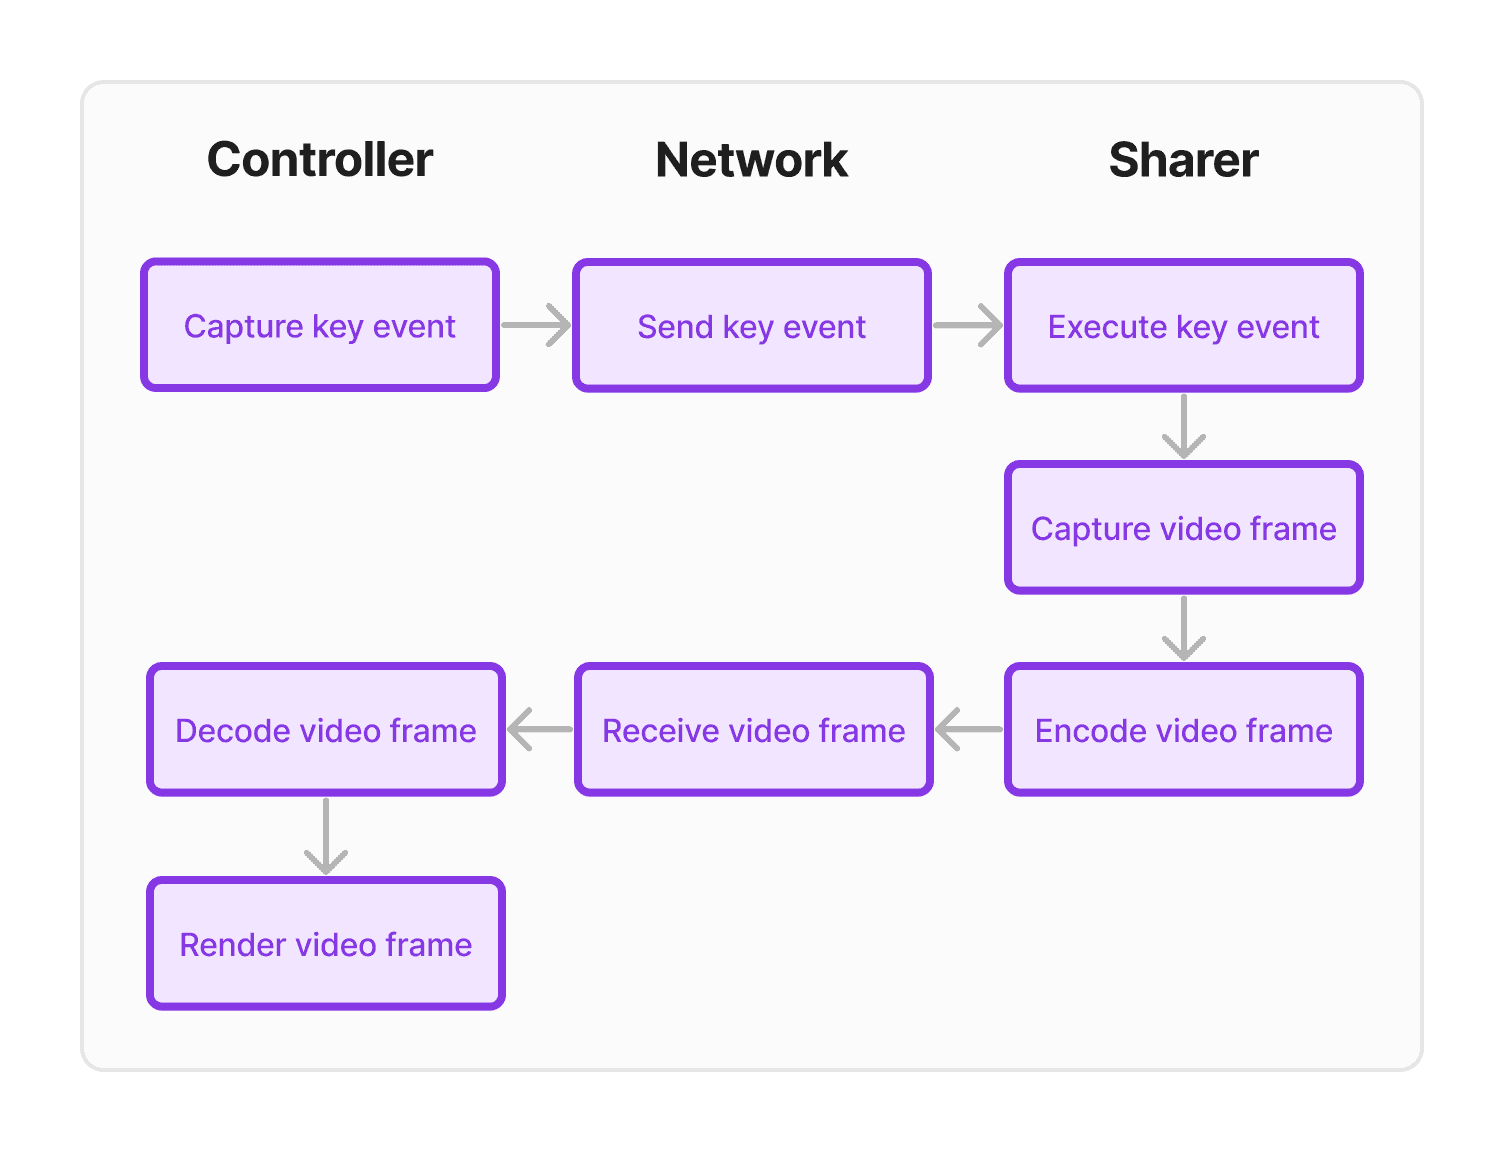
Let’s start by breaking down the different parts that are involved when pressing a key while remote controlling:
Capture key event: A Core Graphics event tap captures events while controlling a display. We use AppKit key events when controlling a window.
Send key event: Serialize the event, send it through the network and then deserialize it on the other side.
Execute key event: Execute the key event using a CGEvent.
Capture video frame: Use ScreenCaptureKit to capture video frames.
Encode video frame: WebRTC codec encodes the frame.
Receive video frame: WebRTC packetizes the encoded frame, sends it over the network and then depacketizes it on the other side.
Decode video frame: WebRTC decodes the frame.
Render video frame: Render the frame using Metal.
1b. Measurement approaches
To assess the perceived lag of say, pressing a key, we need to measure most of this latency. We ended up building three approaches of increasing complexity, each with their own tradeoffs:
i. Data channel ping: A lower bound on round-trip network latency
ii. End-to-end ping: A comprehensive test, but that cannot be measured in production
iii. Watermark ping: A test that captures most of the network variability, that can be used in production
1bi. Data channel ping: A lower bound on round-trip network latency
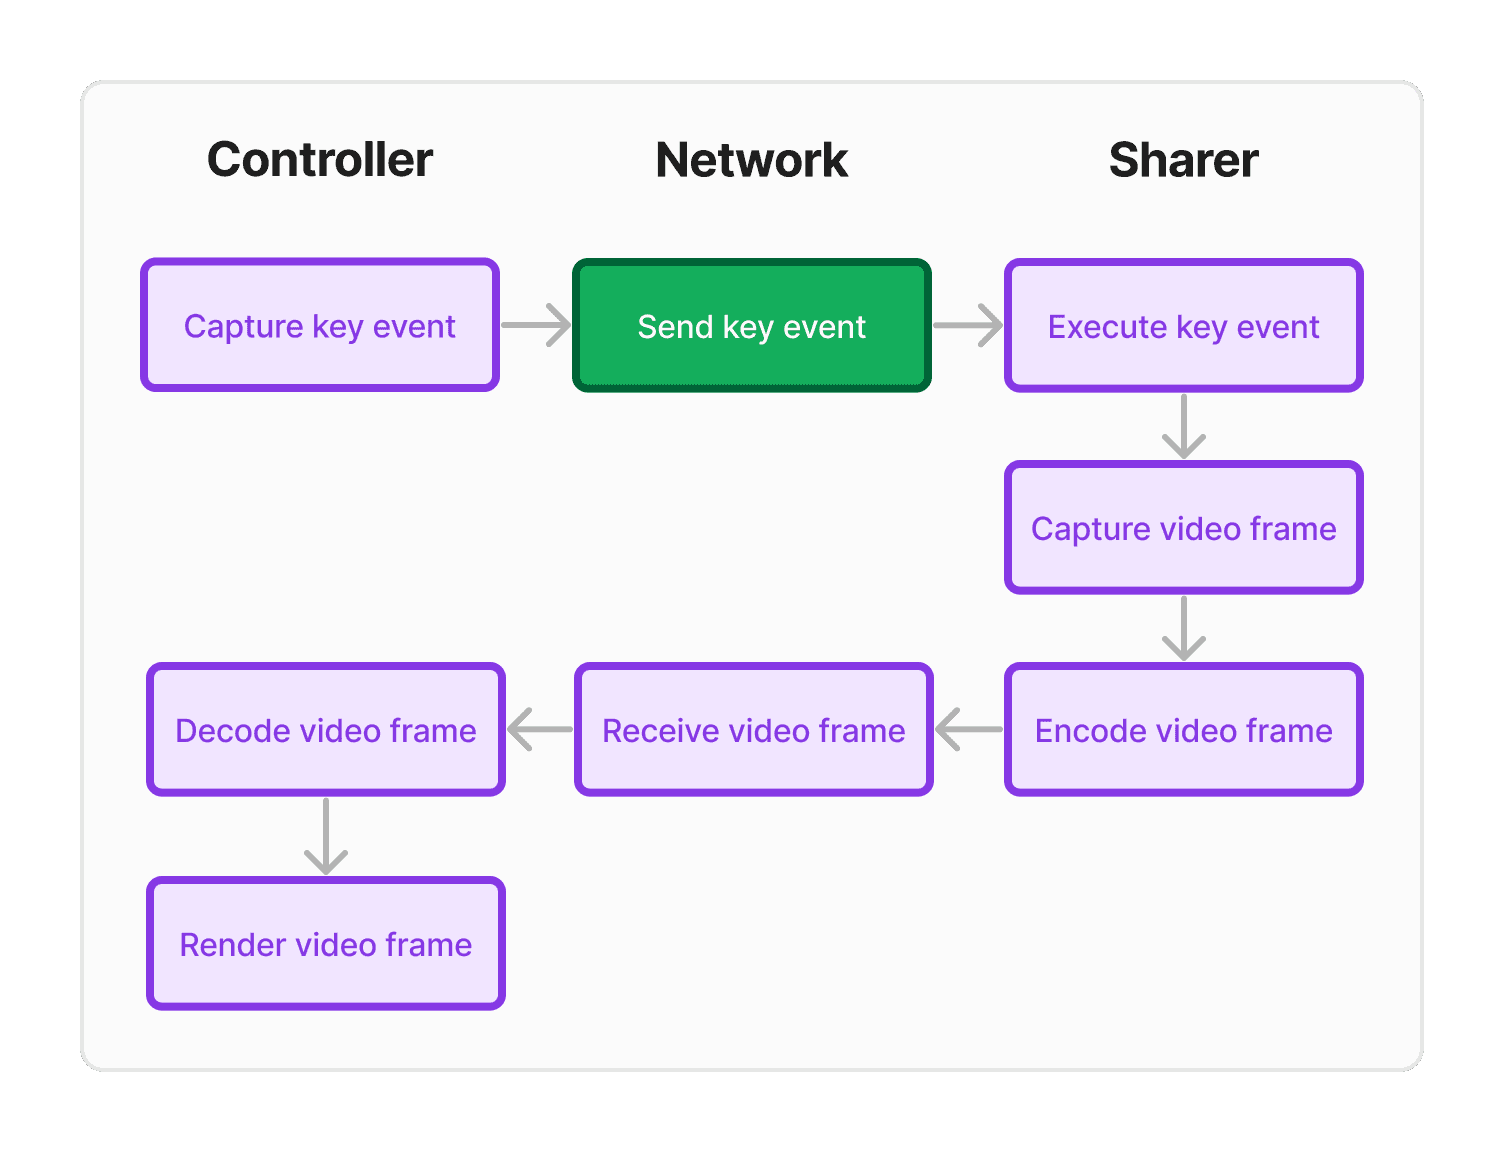
This is the most basic way to measure latency. The controller sends a message through the data channel and sharer responds through the data channel as well.
Utility:
Simplest way to measure latency and reveal current latency in the network.
If we divide the total ping latency by 2, that gives us roughly the Send key event time.
Because encoding/decoding is trivial and the payload size is tiny, this gives us a lower bound on our latency for any given network configuration. (If we were unscientifically having far too much fun with this, we might call this ping a “Carnot Cycle.”)
Weaknesses:
This measurement excludes steps with higher latency, such as encoding/decoding, as well as transmitting the much heavier media payload on the way back. Unfortunately, that’s where most of the room for optimization lies.
1bii. End-to-end ping: A comprehensive test, but that cannot be measured in production
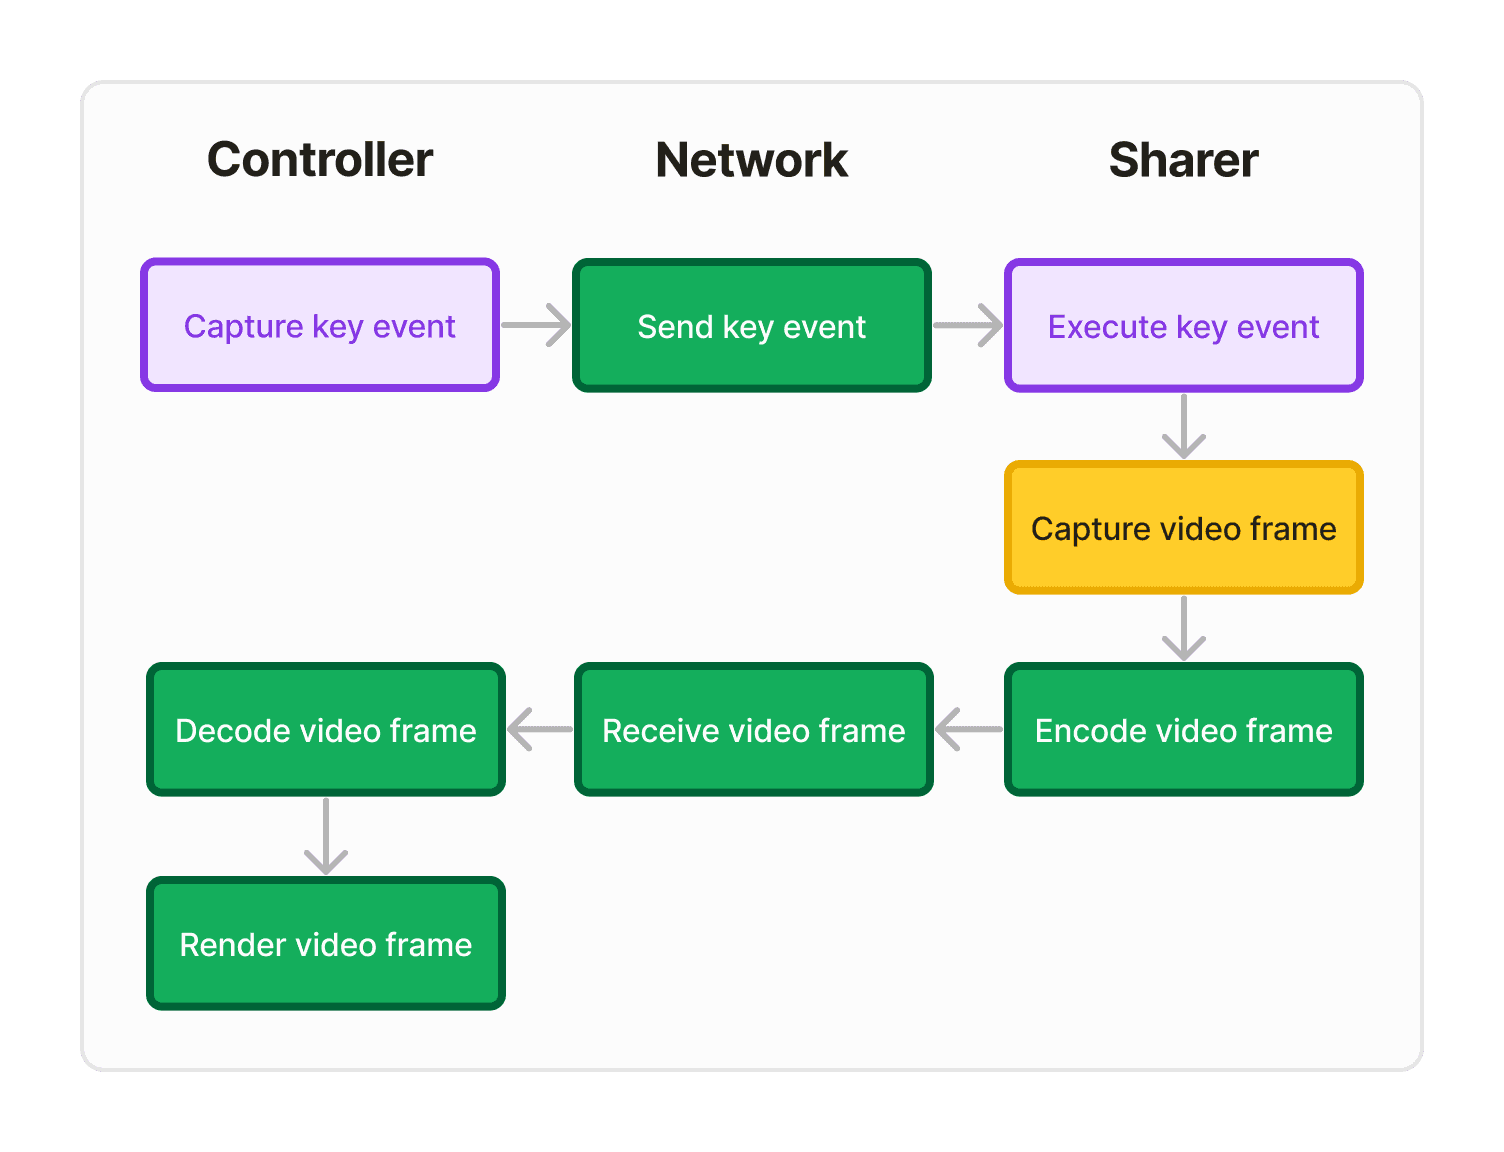
A comprehensive approach to capture user-perceived latency. The controller sends a message through the data channel, then the sharer’s app updates some visible UI. Once we capture that frame, the response comes as a change in the video stream.
Utility:
Captures latency from everything except capturing and executing key events—which are negligible.
Weaknesses:
Not invisible if used to monitor latency for users in production, because it depends on showing a window and including it in the screenshare.
Requires careful consideration of how to update the UI to show the response. For example, our approach updated the background color of a view in SwiftUI. We later realized that due to SwiftUI’s asynchronous render cycle, the UI latency of updating a background color is slower than that of updating a text view to reflect typing. (And editing code is the primary application we want to be fast.)
1biii. Watermark ping: A test that captures most of the network variability, that can be used in production
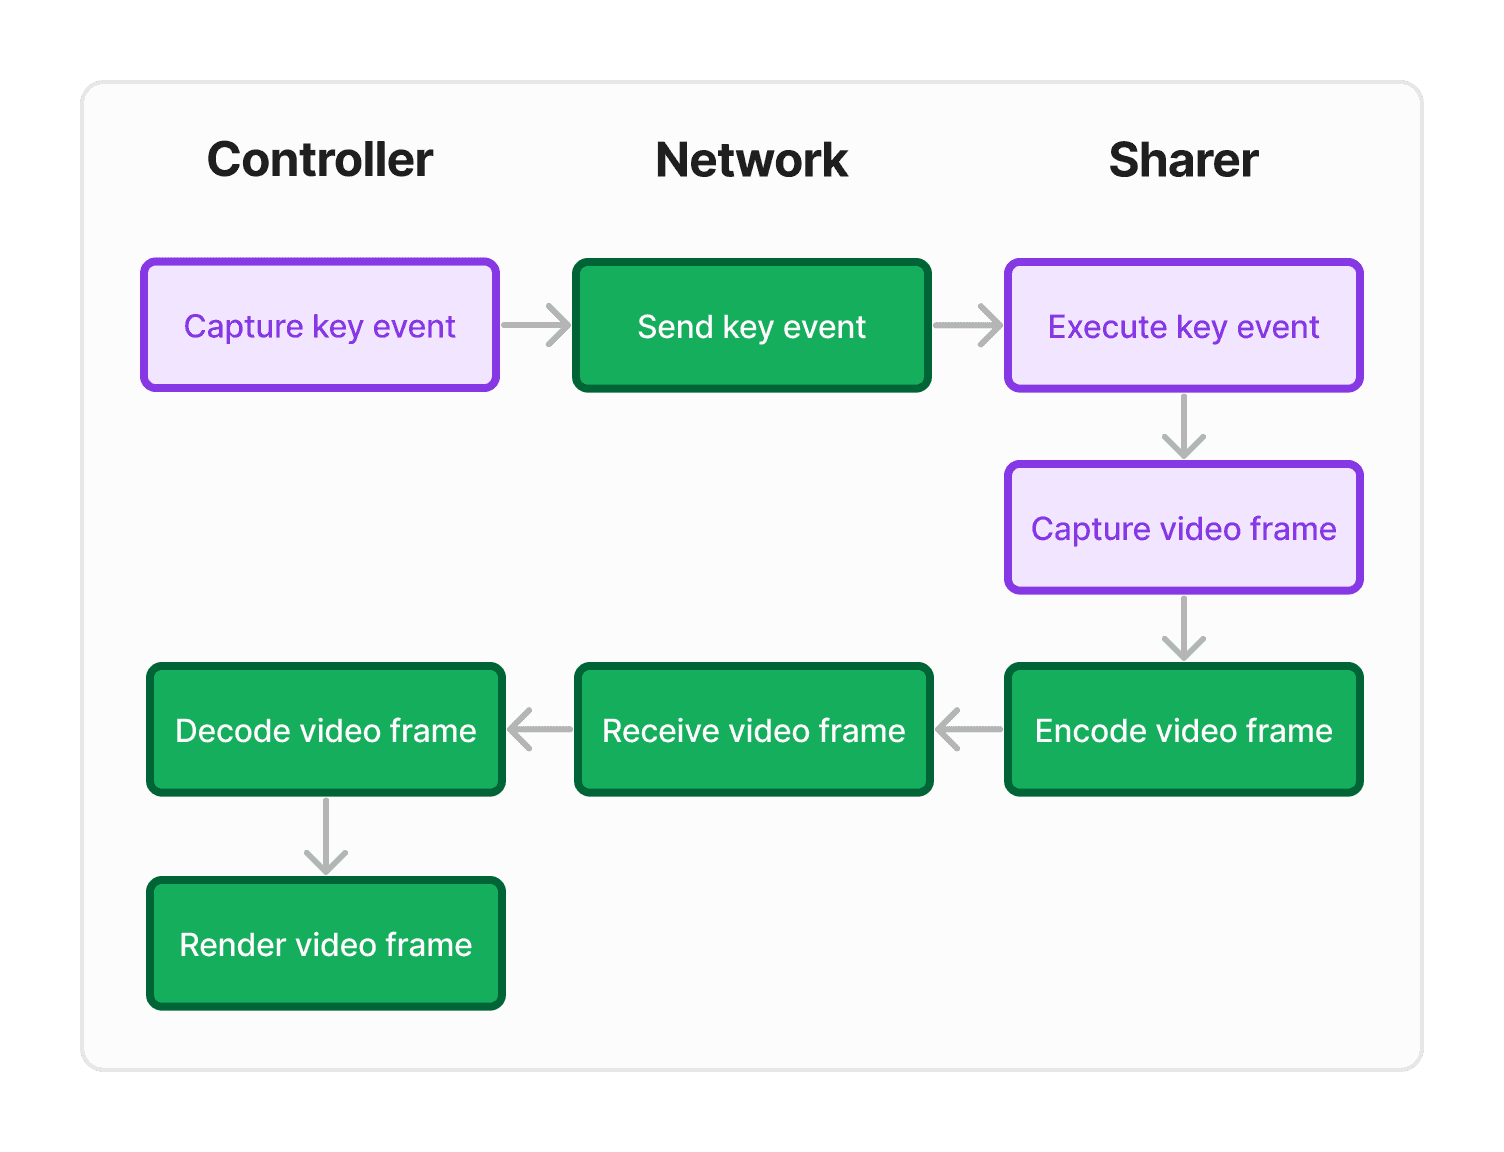
A background way to measure most of the latency in prod, that does not affect the user experience.
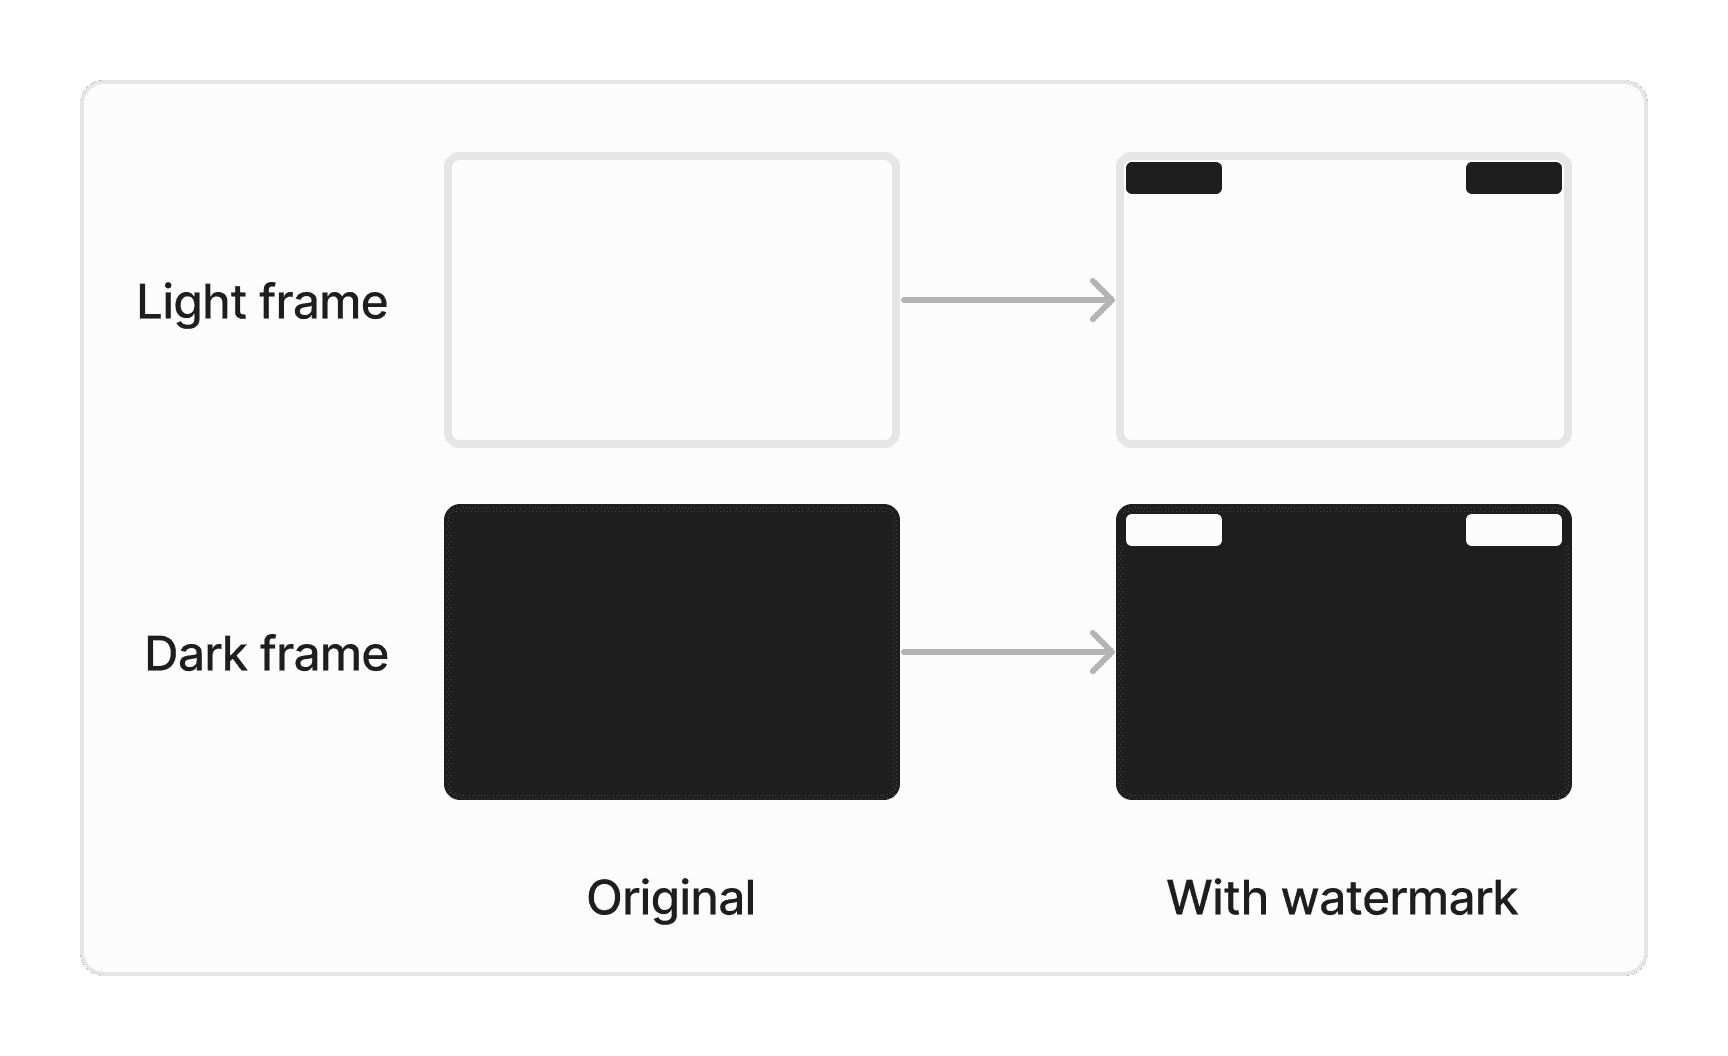
We add two 1-pixel-height marks at the top-left and top-right corners so we can detect them on the controller side. These marks are invisible to users because they are occluded by the screenshare border UI in our app.
The controller starts by requesting a watermark that contrasts with the frame:
When the sharer receives the watermark ping over the data channel, it applies the watermark to the frames.
The controller who requested the ping can then read an estimation of the current mark like this:
Although this strategy is simple, it is stable enough to resist noise from the encoding and decoding processes. Given the current value read, if it’s close to 16 we can infer that it was a black watermark and if it is close to 235 it was a white watermark.
When the controller next wants to assess latency, it simply continues pinging, alternating between requesting white and black watermarks.
Finally, to minimize unnecessary bandwidth use during the pairing session, we avoid reporting these latencies to our server during the session. Instead, once the session is over, we locally compute the p50, p90, and p99 latency, and report those 3 values. (Arguably, reporting these tiny analytics payloads would have a negligible effect on the pairing session—call it a philosophical choice.)
Utility:
Captures encoding, network, and decoding latency, which cover most of the variable latency
Can be run in the background for users in production
Weaknesses:
Does not include ScreenCaptureKit frame capture latency. Luckily, we got this latency is reliably under 10 milliseconds depending on hardware and shared content. With only a few milliseconds left to gain here, it does not comprise much of the variability on prod. Instead we can work on improving it locally.
Does not include including target app render time—although one could argue this is utility, since it’s outside of our control.
1c. When we use each measurement
We periodically sample the watermark ping latency for users in prod.
While developing, or if a specific user shares feedback, we use an end-to-end ping.
We use the data channel ping as our lower bound.
Challenge 2: Reaching confidence despite overwhelming variance
2a. Running a two-tailed AB test required too many samples
Using our watermark metric, we started measuring our baseline implementation of shared control, which runs over Zoom’s high-quality but also high-latency screenshare:
Mean: 595ms
Standard deviation: 2173ms
595ms latency is terrible! But we already knew that from user feedback. Worse, our standard deviation was enormous. This means we'd need many data points before we could confidently detect changes.
Required sample sizes for a two-tailed AB test:
50% latency change: 840 samples
20% latency change: 5,200 samples
10% latency change: 21,000 samples
Significance level of 5% and a power of 80%. See appendix for formula.
With this distribution, we knew we’d be able to quickly notice massive changes in latency, but it’d take prohibitively many samples to test the incremental tweaks that add up to a high-quality audio/video experience. We needed a better way to tease apart changes.
PS As we collected more samples on the Zoom latency, it ended up settling to a much more reasonable mean of 306ms and standard deviation of 179ms. But at the time of working on the project, we didn’t know where it would net out.
2b. Sources of variance
Of course, we weren’t letting stats theory hold us back from building and testing our new P2P pipeline with early users. As we started getting data points from the new pipeline, we inspected them to try to understand where the variance was coming from.
Apologies for the formatting—Framer doesn't support tables.
The first major source of variance was the connection type. Our P2P prototype was slightly faster (not yet faster enough though). But when it had to hop through a turn server, it was much slower than Zoom. We controlled for connection type by adding logging to our analysis.
The second major source of variance was which two users were pairing. Although we weren’t looking at location data, we knew that physical distance was likely the biggest factor. For example, a round trip from New York to Sydney at the speed of light takes over 100ms. And to account for this…
2c. Increasing signal with a paired t-test
Instead of comparing latencies on different pipelines directly to each other, what if we look at the change in latency experienced by pairs of users?
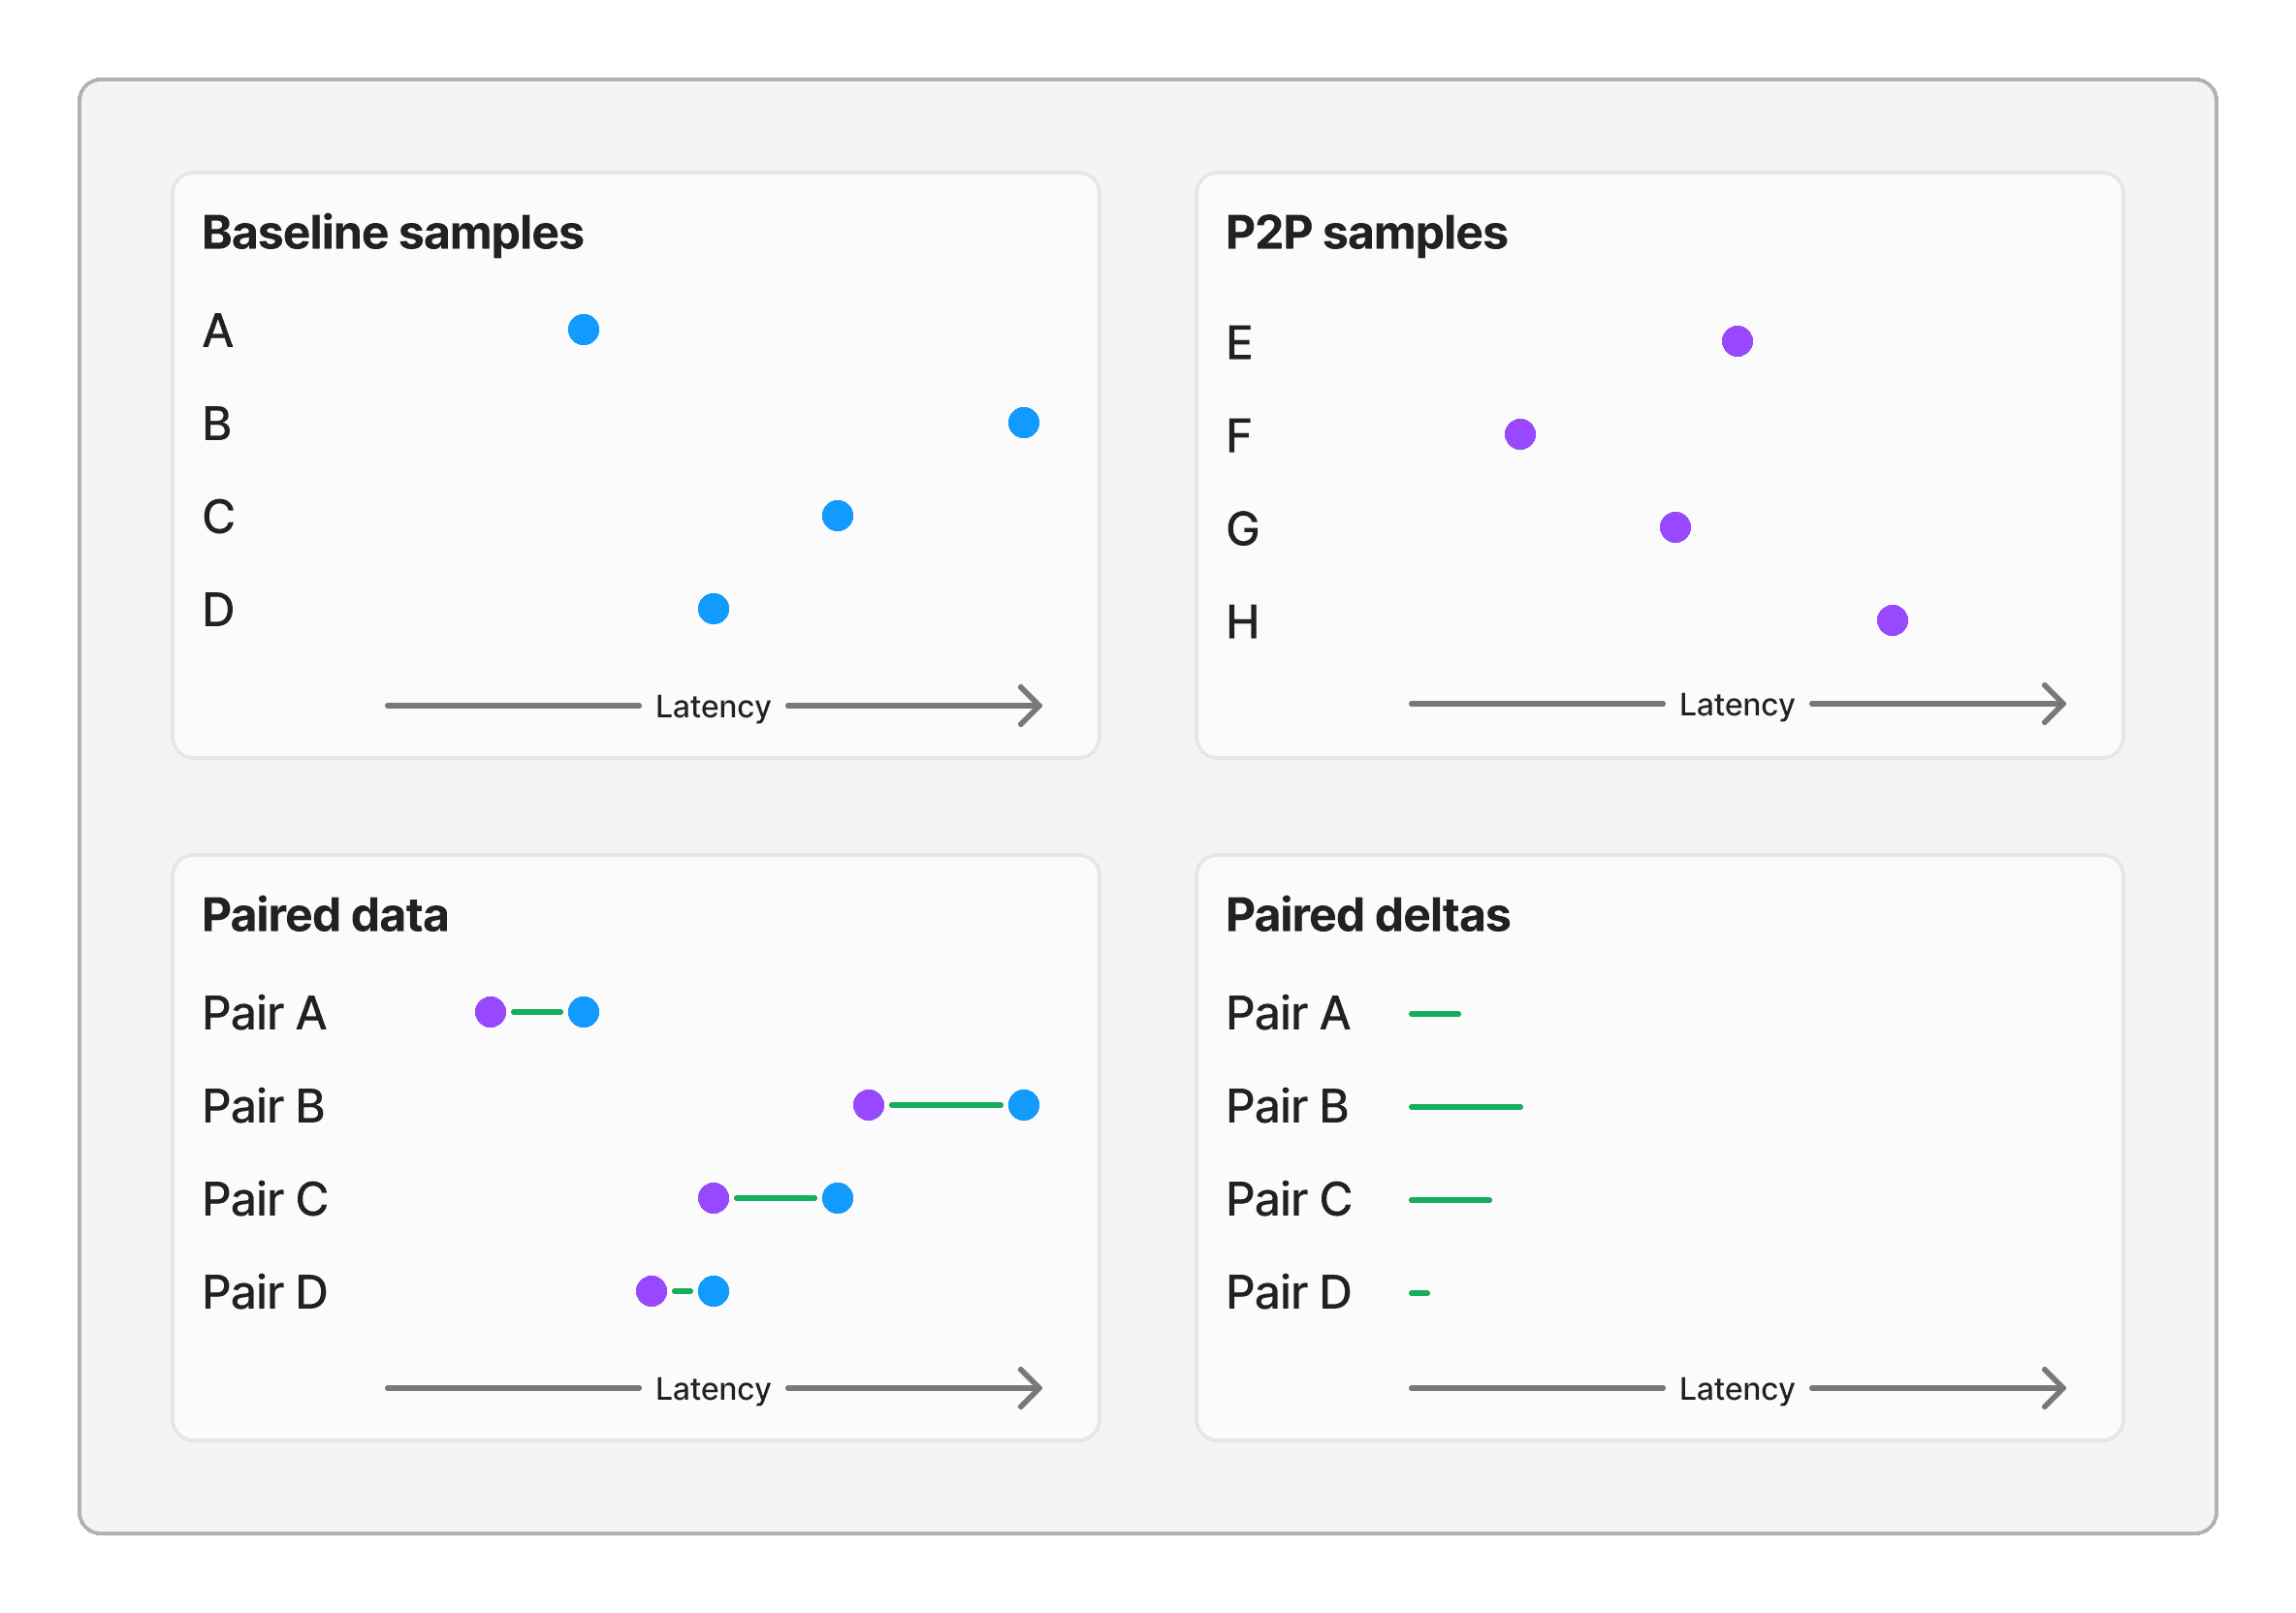
Here's what the paired deltas look like after crunching the numbers:
Mean delta of prototype P2P from Zoom: 111ms
Standard deviation: 107ms
Required sample sizes for a paired t-test
50% latency change: 29 samples (vs 840 before pairing)
20% latency change: 180 samples (vs 5,200 before pairing)
10% latency change: 730 samples (vs 21,000 before pairing)
Much more tractable!
Conclusion
That was a ton of work, but now we have an automated latency test in prod, and we’re able to detect small changes with only a few hundred paired samples.
From here, we were able to reduce latency in our P2P pipeline signficantly further, as well as increase the legibility. For how we configured WebRTC to our use case, check out part 2/2 in the series: Making slow, illegible WebRTC screenshare fast & legible.
If you've had to solve a similar problem, we’d love to hear how you approached it. Drop us a line at (Fernando|Alexander) @ multi.app or @fbarbat | @embirico on Twitter. Finally, we'd love it if you tested shared control in Multi, and let us know what you think!
